Courtesy: Delta Dental Plans Association
If you ask me, there’s nothing more annoying than “experts” who make predictions they’re never accountable for. Well, you didn’t ask, but that’s a pet peeve. And for today’s #TBT blog post, we get a chance to actually look back at predictions about radio revenue made exactly five years ago. And what’s unfair about it is our expert couldn’t have possibly predicted a global pandemic would occur nine months after he put on his swami hat, stared into the crystal ball, and gave us his view of the future.
Not to worry. Our mystery seer is up for the task. And while he didn’t predict the shutdown of every American big city the next year due to the pandemic, his background in and knowledge of radio is more than enough to get your attention. And here’s the thing – his vision about radio and its revenue picture turned out to be pretty spot on. In fact, you shouldn’t feel bad if you can’t help but wonder “what if” more people had listened to him back in 2019.
Well, that’s water under the bridge. But this post still makes for an entertaining and interesting read. It was originally written by my other half, Paul Jacobs, who also knows a thing or two about revenue and how to generate it.
So, pull up your spreadsheet, and let’s look back at radio’s quest to carve out a bigger piece of that elusive revenue pie. – FJ
By Paul Jacobs
June 2019
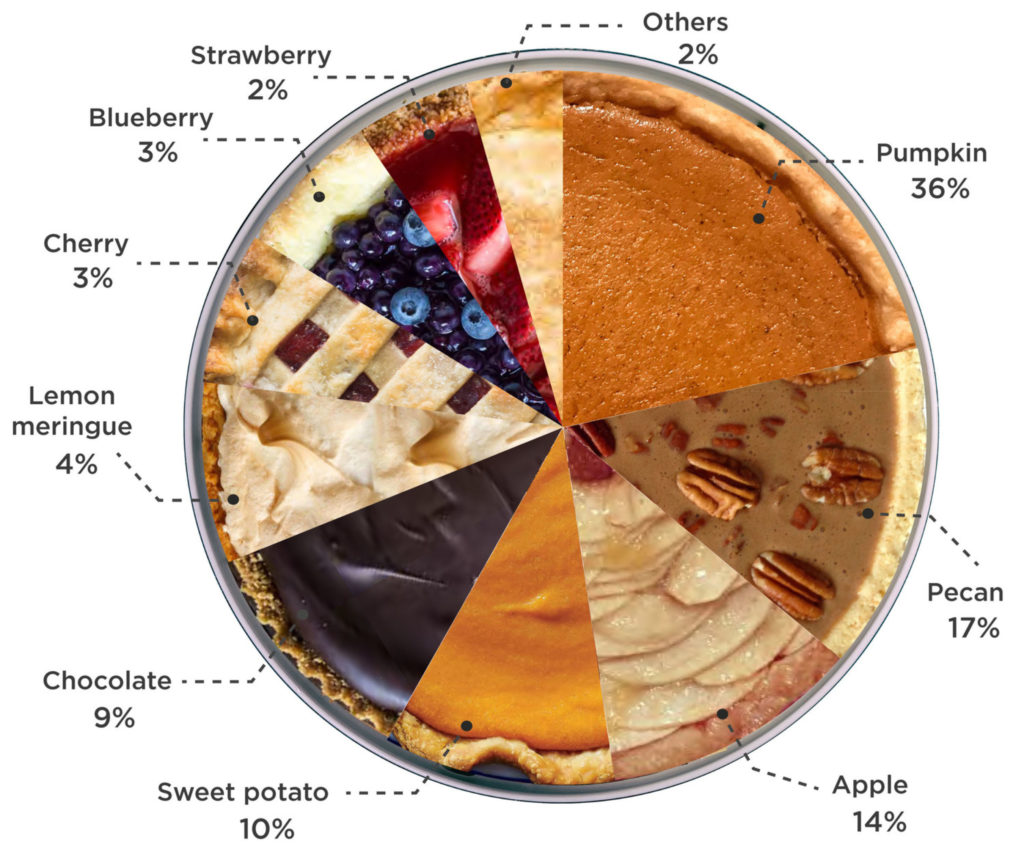
I love pie charts – especially when they’re about pies!
The one you’re looking at gracing the top of today’s post is especially easy to read – a study about America’s favorite pies for the Thanksgiving holiday. No question about it – pumpkin is the clear-cut favorite, more than twice as popular as the runner-up – pecan.
That makes sense. You probably suspected that pumpkin would be numero uno during America’s favorite family food fest. It’s a pretty intuitive result, right?
Unlike Fred’s post from a couple weeks back about radio’s share of the content and revenue “pies.” That turned out to be the most-read blog post of that week, eliciting numerous comments here and on our social media pages. Some commenters weren’t sure the results were reflective of today’s media world. Others wanted to see some context from previous years’ data.
As most of you know, I am not a financial analyst nor am I an economist. But I meet with broadcast radio sales teams, month in and month out. It is clear to me the industry is leaving money on the table, largely because of a lack of strategic focus on where the dollars are shifting.
The revenue chart Fred posted illustrates this. (I included it again below.) It’s the newest estimates for 2019 from BIA Advisory Group. And after that blog post was published, it  turned out to be especially provocative because of shifts in traditional media category spend – including broadcast radio.
To get clarification, I went to the expert: BIA Managing Director Rick Ducey. He’s among the most respected of media analysts, celebrating nearly two decades with the BIA team. He holds a PhD from Michigan State (Go Green!), and previously worked for the NAB.
Rick agreed to answer a number of my questions and yours, especially important as the financial ground underneath the media ecosystem shifts. As you’ll see below, its BIA Advisory Services 2019 data on top, with new forecasts for 2023 below.
This is “media climate change,” and it’s happening before our very eyes.

Source: BIA Advisory Services, June 2019

Paul Jacobs: Rick, I see you’ve added a new 2023 forecast chart to the 2019 version Fred posted last week. Looking at the two charts overall, where do you see the dollars shifting – and why?
Rick Ducey: First, you’ll note that we’re taking radio’s “share of wallet” down a notch (2019-2023), while crediting some growth for radio’s digital offerings (typically, web sites and apps). Overall, the secular shift of “digital dollar drift” continues with total ad spend allocated to digital platforms increasing from 36.6 percent to nearly half (47.7 percent) of all local advertising.
As you can see in the charts, the digital platforms are growing. Buyers are shifting to digital because of its ability to better target audiences beyond gender and age. Add targeting based on location intelligence, behavioral, and deep consumer profiling is huge. Digital platforms also provide ROI and attribution that are very powerful confidence builders for buyers in making media allocation decisions.
 By the way, with our BIA ADVantage local market intelligence platform, we provide all this data for every local radio market – 5-year forecast for 16 media and 94 business categories. We see several clear shifts underway.
PJ: Your 2019 estimates show over-the-air (OTA) radio generating 8.9% of the total, with 1.1% of revenue online. How does this compare with past years – are radio dollars shifting? Growing?
RD: No, sorry to say that radio dollars are not growing as a percent of the buyer’s “share of wallet.” Even with overall growth in ad spending, radio’s share of dollars is decreasing in relative (8.7 percent versus 7.7 percent) and absolute terms ($12.9 billion to $12.6 billion). We do show some growth in radio’s online (web site and mobile app) ad revenue.
PJ: Conversely, how are radio’s traditional competitors – newspapers, television, out-of-home (OOH) faring? Is there any joy in the knowledge radio has passed newspapers and is close to TV?
RD: As you might expect, we show continued declines in traditional ad platforms versus digital platform growth. The OOH segment has two parts, the traditional part and the digital part. Digital OOH is growing fast, particularly digital video signage.
The other standout is direct mail. Even with all the digital drift in spending, direct mail has held its own. We see this category finally succumbing a bit with a drop from 24.9 percent in 2019 to 22.2 percent of total local ad spend in 2023. Our estimates for this category track higher than other industry forecasters because of our methodology, but generally there is consensus that this category is stable with a huge base of business from all categories and sizes investing in it.
 PJ: The pie chart contains three slices of digital revenue not affiliated with a traditional media provider – Online/Interactive, Mobile, and Email. Can you describe what makes up each of those categories and identify the best areas of opportunity for radio broadcasters?
RD: Very good question! Our methodology defines “online/interactive” as ad spend targeting desktop/laptop/tablet devices, “mobile” ad spending targets smartphones and feature phones, and “email” includes any kind of email regardless of device or platform.
Radio sellers tend to focus their own online sales initiatives around display ads on their web sites (e.g., home page takeovers, personality pages, news/traffic/weather pages) and mobile apps (display ads and sponsorships).
Marketers and their agencies increasingly develop campaign strategies using more data science and algorithms to create consumer segmentations  based on literally thousands of data signals. This provides buyers with quantitative insights into consumer purchase journeys and which media they use at different points in that journey. Marketers get insights into which media are more impactful at each stage and allocate spending and relevant creative to those marketing touchpoints. I’m not saying buyers have totally left silos of traditional and digital teams, but we’re getting there.
With the increasing focus on data, multi-platform and multi-touch integrated ad campaigns, radio sellers have a terrific opportunity to take leadership in this narrative. Keep selling your sites and apps, but that won’t amount to much revenue or be very competitive with the duopoly. But do engage with your clients in their multi-touch cross-platform strategies. Create downstream metrics and KPIs (key performance indicators) radio can confidently promise. Things like lift in client website, search, apps downloads and even foot traffic that can be tied back to radio spending.
By using the growth in digital as a tool to show how radio contributes to KPIs, buyers might be encouraged to consider that perhaps they are underweighted in radio as a medium that drives down-funnel digital engagement.
PJ: If you owned a radio station, which of these three would you target?
RD: Without question, all three. We need to leave behind silo thinking. It’s a multi-platform, multi-touch marketing universe these days. Or at least getting there fast. Radio sellers can educate their clients to this. Sit down with them and see what digital dashboards they are using to track the spending and performance in online, mobile, and email. Have them move more into radio but at the same overall spending level and have them watch the needle move.
Let me open up a bit here and share some of our proprietary data analytics and strategy recommendations we just sent to our BIA ADVantage clients in a new report. This example is a QSR (quick-service restaurants) case study for Washington, DC.
According to our data, in the Washington, D.C. market, QSRs spend a total of $89.3 million in local ad spend across 16 media platforms. About 9.4 percent of this goes to radio over-the-air, and another 1.6 percent goes to radio’s digital ad inventory.
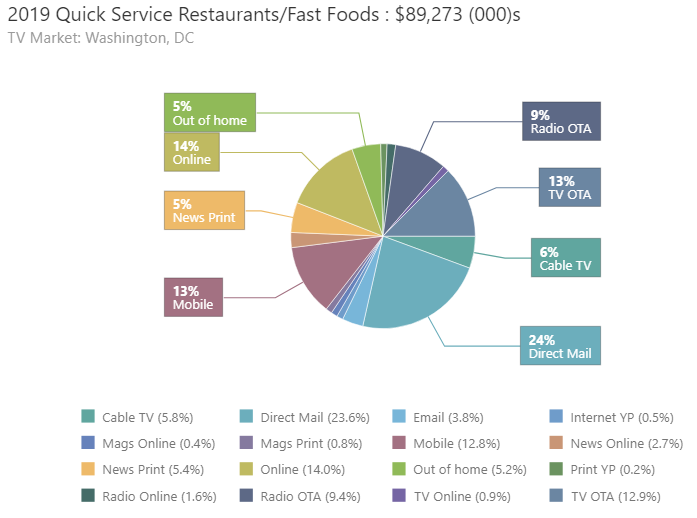
Source: BIA Advisory Services, June 2019
Here’s the strategy we recommended. With a special MRI-Simmons partnership, we’re able to share the chart below that helps radio tell a whole different story in the QSR segment. While our data show that Radio, between over-the-air and digital gets 11 percent of the total “share of wallet” for Washington, DC local ad spending, the MRI-Simmons data shows that QSR consumers are heavy radio users.
Furthermore, Chipotle’s consumers over-index in Internet use. A clear radio selling strategy in this market would be to target Chipotle with an integrated radio-digital campaign. Show how radio can drive digital lift for Chipotle’s metrics and KPIs (key performance indicators) as well as achieve branding goals.
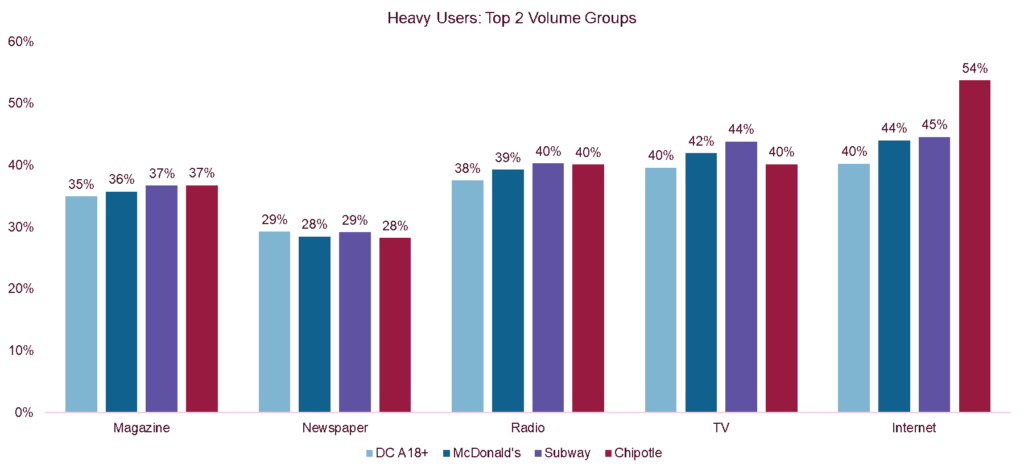
Source: Simmons Local, Fall 2017, Washington, DC. Courtesy of MRI-Simmons
We believe selling strategies like this can help radio drive revenue growth in the QSR category. Each of the 94 categories we provide data for in local radio markets have their own radio stories to be told.
You can learn more by visiting BIA’s website.
And more resources are available at BIA ADVantage local market intelligence platform.
Subscribe to BIA’s great daily newsletter – scroll down to the bottom of this page.
Originally published by Jacobs Media


